Understanding your Reports
OPEN ENDED RESPONSES
MATRIX (TABLE) QUESTIONS
Ratings Scale Questions- Weighted Responses
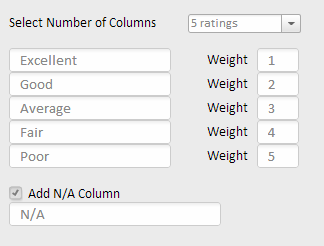
Ratings scale question will have an additional field for average rating. When you create this question, the default weights that correspond to each column start at 1 and go up 1 for each response (ie,1, 2, 3...). You can change these values to any whole numbers (negative or positive) even after you have distributed your survey and are collecting responses.
If you use a N/A column, it will automatically be weighted at 0.
Example: We've created a question with five rankings, with default weights.
After 85 responses, the report would look like this:
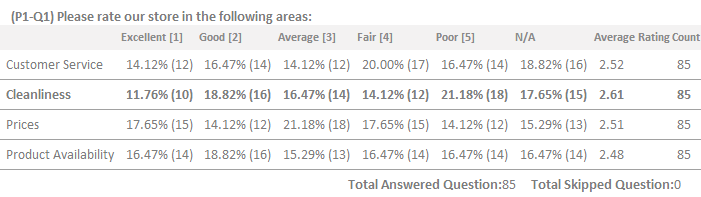
In the screenshot above, the numbers in the header columns (ie, Excellent-1) are the weights. The number next to the percentages in each is the number of people who selected that response. In order to get the average rating, we multiply the percentage of people who selected the response by the weight and add them all together. For example, to calculate the average rating for cleanliess, we would use the following formula:
(14.12%*1)+(16.47%*2)+(14.12%*3)+(20.00%*4)+(16.47%*5)=2.52
An average rating of 2.52 falls right between Good and Average.
Related Topics